Is Bilateral Ablative Surgery for Parkinson’s Disease Still Effective? Long-Term Follow-Up Control Study of 394 Patients
Is Bilateral Ablative Surgery for Parkinson’s Disease Still Effective? Long-Term Follow-Up Control Study of 394 Patients
Nazar Vasyliv *1
*Correspondence to: Nazar Vasyliv, University of Edinburgh, MD, MSc, PhD candidate, Centre for Clinical Brain Sciences, Cancer Research UK Edinburgh Centre, Edinburgh, Chancellor's Building 49 Little France Crescent, EH16 4SB, University of Glasgow affiliate, Wolfson Wohl Cancer Research Centre, Institute of Cancer Sciences, Garscube Estate, Glasgow, UK, G61 1QH.
Copyright
© 2023 Nazar Vasyliv. This is an open access article distributed under the Creative Commons Attribution License, which permits unrestricted use, distribution, and reproduction in any medium, provided the original work is properly cited.
Received: 23 October 2023
Published : 02 November 2023
DOI:10.5281/zenodo.10066988
Abstract
Aim:
This study aimed to assess the efficacy of bilateral stereotactic lesion procedures in the treatment of Parkinson's disease (PD).
Materials and Methods:
An analysis was conducted on 394 patients who underwent bilateral stereotactic procedures in our department between 2008 and 2018. The procedures involved stereotactic thalamotomy and contralateral pallidotomy (first group) or stereotactic thalamotomy and contralateral subthalamotomy ( second group). The surgeries were performed using the CRW Stereotactic system with the StereoPlan, StereoAtlas (Radionics), and FraimLink (Medtronic) software. Postoperative follow-up ranged from 1 to 7 years, with the mean duration of 4.2 ± 0.8 years.
Results:
One year post-intervention, the Unified Parkinson's Disease Rating Scale (UPDRS) score showed a significant improvement of 52% in the "ON" period and 41% in the "OFF" period. Tremor regression was observed in 335 (85%) patients, rigidity in 354 (90%), and bradykinesia in 231 (58.7%). Additionally, there was a 37.0% re- duction in the L-dopa dose after surgery. Complications were noted in only five cases (1.2%). The overall mortality rate was 0.5% (2 patients), and three patients experiencing transient neurological deficits that were not permanent.
Conclusion:
Bilateral lesion interventions offer patients the opportunity to reduce their reliance on levodopa, resulting in increased independence from complex medication regimens. Careful selection of patients for ablative procedures can yield optimal outcomes in PD management.
Keywords: Ablative surgery, Parkinson's disease, Quality of life.
Is Bilateral Ablative Surgery for Parkinson’s Disease Still Effective? Long-Term Follow-Up Control Study of 394 Patients
Introduction
Deep brain stimulation (DBS) has emerged as the predominant method of surgical intervention in Parkinson's disease (PD) since its introduction in 1987 by Professor Alim Louis Benabid at the University Hospital of Grenoble, France. It has largely replaced ablative procedures because of its proven effectiveness and safety (1,4). DBS offers several advantages, including the capacity for bilateral electrical subcortical brain stimulation, precise electrode localisation, efficacy in treating bradykinetic forms of PD, and the ability to adjust stimulation parameters non-invasively to tailor therapy to individual patient needs (1, 8).
Despite the generally low rates of adverse events associated with DBS, there are no complications that can significantly affect a patient's quality of life. These complications fall into two categories: hardware- and stimulation-induced adverse events. Hardware-related complications included infection, skin erosion, seroma, lead migration or fracture, system malfunction, and battery depletion. Notably, hardware-related infections occur in 1-15% of patients following DBS treatment and often require complete system explantation, making it one of the most severe complications (10, 17, 18). Stimulation induced adverse events include dyskinesia, dystonia, vocal hypophonia, gait disturbances, weight gain, hypersalivation, dysphagia, psychiatric disturbances like mania or depression, cognitive disturbances, submanic states, and impulse control disorders (10, 17, 18). Furthermore, the high cost of electrical devices is a drawback. As the number of DBS surgeries has increased, so too have complications related to malpositioned electrodes, tolerance to stimulation, and reduced efficacy have been reported (8, 11, 13, 14). In a review of reported series, adverse effects were noted in 19% of patients who underwent DBS of the subthalamic nucleus (STN) (19, 20). A concern is the apparently elevated suicide rate among patients who have undergone DBS surgery, with one study reporting a rate of 4.3% in a cohort of 140 patients (21).
This resurgence in interest in lesioning interventions for movement disorders stems from studies that have shown no significant difference in the quality of life between ablative treatments and DBS for PD in the long term (Richard Schuurman, 2008). Additionally, a few reports have suggested that thalamotomy may be a viable option for patients who do not respond to DBS because of complications such as malpositioned electrodes, tolerance to stimulation, or loss of efficacy. Radiofrequency (RF) lesioning has been successfully performed using DBS electrodes in some cases (Pérez-Suárez, 2017). Over the past decade, stereotactic ablative techniques have seen significant advancements owing to improved instrumentation and electrophysiological monitoring methods (3, 16). Recent scientific findings indicate that both the ventral intermediate nucleus (VIM) and internal segment of the globus pallidus play crucial roles in tremor mechanisms (6). Other lesioning targets that have garnered interest include the Zona incerta (ZI), STN nuclei, and field H of Forel (9). Nonetheless, the relevance of ablative surgical procedures persists in the treatment of extrapyramidal movement disorders, considering economic, geographical, and other factors. This study aimed to assess the effectiveness of stereotactic bilateral lesion procedures in PD patients.
Materials and Methods
In this study, 394 patients underwent stereotactic thalamotomy and contralateral pallidotomy for the treatment of (PD) between 2008 and 2018. The study cohort consisted of 208 men (52.9%) and 186 women (47.1%). The patients were categorised into distinct groups based on the specific target of intervention, resulting in 267 cases (67.7%) in the thalamotomy and contralateral pallidotomy group (referred to as Group Vim-GPi) and 127 cases (32.3%) in the thalamotomy and contralateral subthalamotomy groups (referred to as Group Vim-STN).
At the time of their initial surgery, the age of the patients ranged from 40 to 72 years, with an average age of 57.5 ± 3.1 years. The interval between the two surgical interventions varied from 1 to 6 years, with an average duration of 2.9 ± 0.5 years. All surgeries were performed under local anaesthesia during the "off-time" period. Consequently, the patients discontinued the use of L-dopa medications for 8 h prior to surgery. Furthermore, patients who were taking antiplatelet medications discontinued this treatment for a period of three days before the surgical procedure.
The neurological and psychological status of the patients was assessed using a range of evaluation tools, including the Unified Parkinson's Disease Scale (UPDRS II), the modified Hoehn and Yahr scale, the Schwab and England scale, the Mini-Mental State Examination (MMSE), Beck's Depression Inventory (BDI), the Hamilton Depression Rating Scale (HDRS), the Hamilton Anxiety Rating Scale (HAM-A), and a test designed to measure the quality of life (PDQ-39). Intraoperative macrostimulation was performed to precisely determine the optimal target location.
Surgical procedures were conducted using the CRW Stereotactic system, facilitated by planning stations from Radionics (StereoPlan, Atlas) and Medtronic (FrameLink) software (6,7). The Vim target was identified using an indirect method based on AC and PC landmarks. The STN and GPi targets were identified through direct targeting of T2, inversion recovery, and proton density-weighted images (Table 1).
|
Target coordinate: AC – PC line, mean |
|||
|
|
Lateral (X) |
A-P (Y) |
Vertical (Z) |
|
Vim |
13.6 |
- 5.9 |
0 |
|
GPi |
21.5 |
+ 2.8 |
- 3.7 |
|
STN |
11.8 |
- 2.5 |
- 4.6 |
Table I:
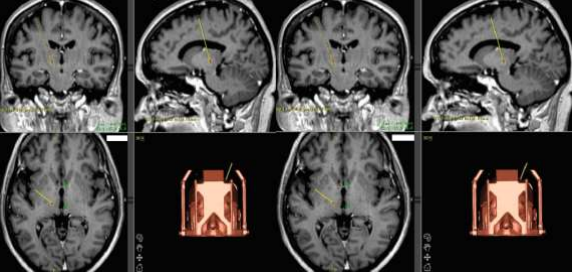
Figure I: Calculated target coordinates for RF destruction. A -ventro- lateral intermediate thalamic nucleus (Vim). B - globus pallidus pars interna (GPi)
Intraoperative macrostimulation was used to precisely determine the optimal target location in all cases. For Vim and GPi lesioning, a radiofrequency (RF) electrode was employed with an exposed tip diameter of 2.1 mm and tip length of 2.0 mm. For STN lesioning, an RF electrode with a tip diameter of 1.4 mm and tip length of 3.0 mm was used.
Before initiating the primary lesion, test lesions were conducted by raising the temperature to 45°C and subsequently to 60°C for Vim and GPi ablations. For STN ablation, the temperature was increased to 45°C, then to 50°C, and finally to 60°C. Thalamotomy and subthalamotomy were performed in a single stage at 75°C for 60 s and at 70°C for 55 s, respectively. In the case of pallidotomy, multiple lesions were performed, with the first lesion generated at 75°C for 60 s and the second at 75°C for 90 s, after withdrawing the electrode by 3 mm from the deeper lesion.
Postoperative follow-up extended from 1 to 7 years, with an average duration of 4.2 ± 0.8 years.
Results
The duration of the disease prior to the first surgery ranged from 4 to 21 years, with a mean duration of 9.6 ± 1.5 years. The time interval between the two interventions varied from 1.1 to 7.5 years, with an average of 2.7 ± 0.5 years. Notably, in the Vim-STN group, the duration between surgeries was slightly longer, although this difference was not statistically significant.
Before the initial intervention, the majority of patients, specifically 336 out of 394 (85.3%), received
L-dopa therapy. The duration of L-dopa therapy ranged from 2 to 20 years, with an average of 4.7 ± 0.7 years. The mean daily dose of L-dopa therapy was 885.8 ± 245.4 mg/ day in Group Vim-GPi, while in Group Vim-STN, it was 375.0 ± 87.8 mg/day. Approximately 47.1% of patients experienced side effects from L-dopa therapy. In the Vim-GPi group, 128 (47.8%) patients presented with combined side effects, with motor fluctuations occurring in 70 (54.6%) patients and levodopa-induced dyskinesia in 58 (45.5%) patients. In contrast, none of the patients in the Vim-STN group exhibited levodopa-induced dyskinesia, although motor fluctuations were observed in 49 (85.7%) cases.
|
|
Vim-GPi, n=267 |
Vi m - S T N , n=127 |
Total, n=394 |
|
|
Age on 1st surgery, years |
56.8 ± 4.2 |
58.7 ± 5.0 |
57.5 ± 3.1 |
|
|
Age on 2nd surgery, years |
59.3 ± 4.0 |
62.2 ± 4.3 |
60.2 ± 3.0 |
|
|
Term between surgeries, years |
2.5 ± 0.6 |
3.5 ± 1.2 |
2.9 ± 0.5 |
|
|
Duration of PD, years |
10.2 ± 1.8 |
9.0 ± 1.5 |
9.9 ± 1.4 |
|
|
L-dopa-therapy, n |
255 (95.7%) |
81(63.6%) |
336(85.3%) |
|
|
Duration of L-dopa- therapy, years |
5.4 ± 0.8 |
4.0 ± 0.6 |
4.7 ± 0.7 |
|
|
Dose of L-dopa, mg/day |
885. 8± 245.4* |
|
375. 0 ±87.8* |
634.4 ± 97.8 |
|
Motor fluctuations, n |
70/128 (54.6%) |
|
49/57(85.7%) |
119/185(62.1%) |
|
L-dopa-induced dyskinesias |
58/128 (45.5%) |
|
0/57 (0%) |
58/185(34.5%) |
Table II: Clinical Presentation
At the time of surgery, all patients were categorised within the 2.5–4.0 stage range on the modified Hoehn and Yahr Scale. Among the 28 patients who underwent assessment using the Mini-Mental State Examination (MMSE), no cognitive impairments were detected after surgery.
In the non-operative group, anxiety levels were higher than depression levels, averaging 28 and 17 points on the Hamilton Anxiety Rating Scale (HAM-A) and Beck’s Depression Inventory (BDI), respectively. In contrast, among the group of patients who underwent surgery, the levels of depression and anxiety were lower, averaging 13 points for the BDI and 26 points for the HAM-A.
The summary indices (SI) of the PDQ-39 test for the 28 patients were analysed using Student's t-test, with an average critical value of 5% based on a two-sided distribution. The significance level was found to be 0.43 with a standard deviation of 2.09. This could be attributed to a significant improvement in the quality of life of the patients who underwent surgery compared with the non-operated control group (p < 0.05). Notably, there have been no reported cases of suicide among patients who have undergone surgery.
|
|
Regression of motor disturbances |
L-dopa therapy (m g/day) Preop/ Postop (on 37.0%) |
UPDRS improved |
Schw ab & Engla nd Preop / Posto p |
|||
|
Tremor |
Rigidity |
Brady kinesi a |
ON |
OFF |
|||
|
Vim-GPi |
219(82%) |
243(91%) |
179 (67%) |
885.8.8/514.8 |
48 % |
44% |
54.2%/ 70.8% |
|
Vim -STN |
110(87%) |
114(90%) |
68(54 %) |
375/276.8 |
50 % |
34% |
59.6%/85.5% |
|
Total |
335(85.0%) |
354(90%) |
231(58.7%) |
630.4/395.8 |
52 % |
41% |
56.7%/80.6% |
Table III: Clinical outcome analysis
Following surgery, substantial regression in tremors was observed in 335 of the 394 (85%) patients. Muscle tone normalisation was achieved in 354 patients (90 %), whereas partial improvement in bradykinesia was noted in 231 patients (58.7 %). Notably, after the second operation, all patients (100%) who experienced
L-dopa-induced dyskinesia and motor fluctuations before surgery showed regression of these symptoms.
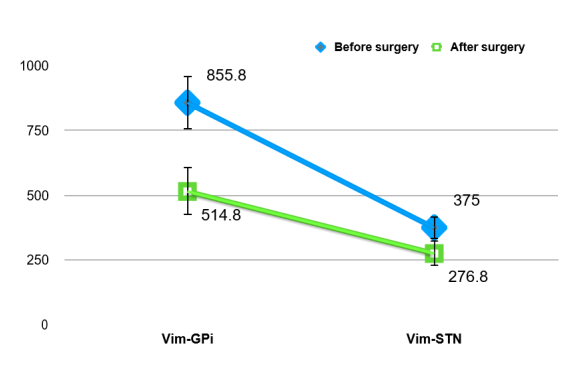
Furthermore, the postoperative reduction in the average levodopa dose was significant, decreasing by 37.0%. The dose decreased from an initial 630.4 ± 97.8 mg/day to 395 ± 199.2 mg/day. Assessments using the UPDRS II were conducted before and after surgery, revealing 52% improvement during the "ON" period and a 41% improvement during the "OFF" period.
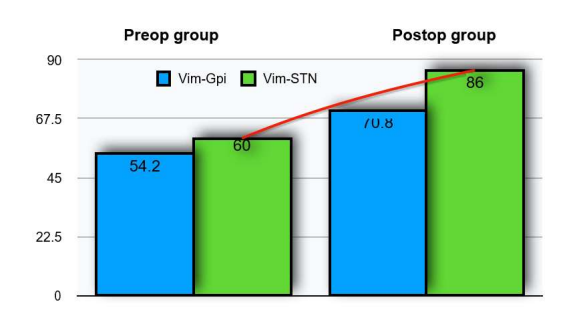
The regression of extrapyramidal symptoms contributed to improved posture, enhanced gait, and increased motor activity. Collectively, these factors had a positive impact on the patients' quality of life and their social and domestic adaptation. This positive impact was substantiated by an increase in Schwab and England Daily Living Scale scores from 56.7% to 80.6%.
Figure II: Comparison of patients with Schwab and England daily activities living scale
Figure III: Comparison of L-dopa (mg/d) baseline therapy in patients with PD
Postoperative complications were observed in 5 (1,2%) observations. In 2 (0,5%) cases after stereotactic thalamotomy, central paresis developed in the contralateral leg, which regressed within 3 months after surgery. In one patient (0,2%), contralateral pallidotomy dysarthria occurred and regressed after rehabilitation period within 1 month after surgery. There were two cases of mortality: one after stereotactic thalamotomy which was caused by haemorrhagic inhibition in the centre of destruction that led to subdural haematoma in the background of cardiopulmonary and kidney disturbances. Another patient experienced severe endocrine disturbances that led to sudden death.
Discussion
An analysis of data from a large number of deep brain stimulation (DBS) recipients in North America has revealed a higher rate of revision and removal of DBS leads. The most frequent reasons for these interventions include hardware malfunction, lead infection, and malpositioning (33). According to North American DBS centres, 81 recipients underwent surgery for Parkinson's disease, of which 66 required revision or removal of the electronic devices. Of these cases, 18.2% were due to device malfunction and 19.7% were a result of infection.
Hardware infections can be associated with various variables and may occur at any point after DBS surgery. Notably, there is a statistically significant increased risk of infection in male patients and individuals who have undergone multiple internal pulse generator (IPG) replacement. This underscores the importance of reducing the frequency of IPG replacement due to the implications, particularly the risk of infection (34,35).
Another cohort study in the United Kingdom involving 138 paediatric patients with dystonia highlighted complications related to DBS. Tragically, ten children passed away after implantation. Surgical site infection (SSI) rates were 10.3% for new implants and revisions, 8.6% for new Activa RC devices, and even lower at 4.7% for new Activa RC devices in patients under 7 years of age. The most common infection site cultures included Staphylococcus aureus, Enterobacter, Streptococcus, Pseudomonas, and occasionally Mycobacterium or Candida. Treatment with prolonged courses of antibiotics proved unsuccessful in 86% of patients with SSI following new implants and revisions, eventually necessitating total removal of the DBS system (36,37).
Complications such as intracranial bleeding can occur following DBS surgery in both patients undergoing RF thermodestruction and those undergoing DBS. In cases of DBS, symptomatic intracranial haemorrhage should be promptly identified post-implantation and effectively treated to minimise neurological deficits and preserve DBS leads (38). Unlike ablative procedures, complications such as dysarthria, reversible paraesthesia, and muscle contractions can potentially be resolved by adjusting the stimulation settings in patients undergoing DBS.
Statistics from Canadian scientific centres have identified several categories of hardware-related problems, including infection, skin erosion, seroma, lead migration or fracture, system malfunction, and rare problems such as foreign body reactions. These problems have been recognised since the early series of chronic electrode implants for pain management (42). An early study reported hardware-related adverse event rates of 24% per patient (39,43). Electrode migration occurred in up to 14% of cases in the early series. Electrode fracture or malfunction could occur due to over-tightened connector screws or excessive movement between the electrode and cable, particularly in the neck below the mastoid. Most fractures occurred near the connection point between lead and extension. Suspected fractures become apparent when patients experience a sudden loss of stimulation benefits. Removal of DBS equipment is typically required. The use of cyanoacrylate glue to attach the electrode to the burr hole ring in early series may have contributed to the formation of granulomas (40, 41, 44).
Informed Decision-Making: A clear understanding of the indications for DBS devices and their potential complications is essential for patients to make informed decisions about DBS technology.
This study demonstrated the high efficacy of stereotactic ablative procedures over the best medical management of patients with Parkinson's disease and levodopa-induced motor complications. Physiologically and clinically, it has been established that the thalamic Vim nucleus serves as the relay nucleus of kinesthetic neurones and that immediate relief from tremors can be achieved by radiofrequency destruction of the Vim nucleus. The results showed a significant reduction in tremors in 335 of 394 (85%) patients, with reductions in rigidity observed in 354 (90%) patients and improvements in bradykinesia in 231 (58.7%) patients with advanced Parkinson's disease. These improvements led to better UPDRS motor scores and increased quality of life, as indicated by an increase in Schwab and England rating scale scores from 64.6% to 90.2%. The beneficial effect of L-dopa therapy in Parkinson's was also confirmed, with a 37% reduction in L-dopa therapy after surgery. The results suggest that the timing between surgeries played a role in how well the operation was tolerated. Combined-destruction procedures were performed due to disease progression and side effects of levodopa replacement therapy. Some postoperative complications were observed, such as dysarthria, possibly due to stimulation of the genu capsulae internae at higher intensities. Motor disturbances were also observed, but tended to improve within 3 months after electrophysiological treatment. The increased technical capabilities of neurosurgeons using modern diagnostic and surgical computer technology have allowed for precise stereotactic destruction and high therapeutic efficacy, while preventing postoperative complications. However, given the high cost of bilateral implants and lifelong patient dependence on electronic devices, this procedure may not be justified. The risk of complications in DBS is notably higher, with infection as a common cause of death, often of respiratory origin, which aligns with studies describing pneumonia as a significant cause of death in Parkinson's (21, 23).
Psychological Outcomes and Further Research: DBS surgery necessitates further research on the psychological well-being of patients with Parkinson's. Various psychiatric symptoms can emerge or worsen following DBS. Meta-analyses have shown that post-operative depression occurs in 8% of patients who underwent STN DBS. Case reports have demonstrated the resolution of mania by adjusting the stimulation settings. However, there have been reports of postsurgical exacerbations of apathy after STN DBS. There have also been cases of suicides associated with DBS (32). Therefore, it is important to further investigate the psychoemotional outcomes of DBS patients.
Financial Coverage:
A financial coverage for DBS surgery is a significant concern for many patients. Additionally, many surgical institutions revisit destructive types of surgeries (30, 31). Experience with stereotactic ablative procedures has shown its clinical efficacy without severe complications.
Conclusion
Stereotactic (RF) destruction is an effective and safe surgical treatment for (PD). This method offers several advantages, such as shorter operation duration, absence of a requirement for lifelong patient monitoring, and lower financial costs associated with acquiring neurostimulation systems.
References
1. Adam Nassery, Christina A. Palmese, Harini Sarva, Mark Groves, Joan Miravite, Brian Harris Kopell: Psychiatric and Cognitive Effects of Deep Brain Stimulation for Parkinson’s Disease. Curr Neurol Neurosci 1: 16- 87, 2016
2. Alterman RL, Kelly P, Sterio D: Selection criteria for unilateral pos- teroventral pallidotomy. Acta Neurochir Suppl 68: 18–23, 1997
3. Anders Fytagoridisa, Tomas Heardf Jennifer Samuelssonb, Peter Zsigmondd Elena J i l t sovae Simon Skyrmana Thomas Skoglundc Terry Coynef, Peter Silburnf Patric Blomstedtb: Surgical Replacement of Implantable Pulse Generators in Deep Brain Stimulation: Adverse Events and Risk Factors in a Multicen- ter Cohort. Stereotact Funct Neurosurg 94: 235–239, 2016
4. Bahgat D, Magill ST, Berk C, McCartney S, Burchiel KJ: Thalamo- tomy as a treatment option for tremor after ineffective deep brain stimulation 91(1): 18-23, 2013.
5. Benabid AL, Pollak P, Gao D, Hoffmann D, Limousin P, Gay E, Payen I, Benazzouz A: Chronic electrical stimulation of the ven- tralis intermedius nucleus of the thalamus as atreatment of move- ment disorders. J Neurosurg 84: 203–214, 1996
6. Benabid AL, Pollak P, Louveau A, Henry S, de Rougemont J: Com- bined (thalamotomy and stimulation) stereotactic surgery of the VIM thalamic nucleus for bilateral Parkinson disease. Appl Neuro- physiol 50: 344–346, 1987
7. Bendok B, Levy R, Gildenberg P, Tasker P: Brain stimulation for persistent pain management. In Textbook of Stereotactic and Func- tional Neurosurgery 1539-1546, 1998
8. Burchiel KJ: Thalamotomy for movement disorders. Neurosurg Clin N Am 6: 55–71, 1995
9. Burkhard PR, Vingerhoets FJ, Berney A, Bogousslavsky J, Ville- mure JG, Ghika J: Suicide after successful deep brain stimulation for movement disorders. Neurology 63(11): 2170–2172, 2004
10. Constantine Constantoyannis, Caglar Berk, Christopher R Honey, Ivar Mendez, Robert M Brownstone: Reducing Hardware-Related Complications of Deep Brain Stimulation. Can. J. Neurol. Sci. 32: 194-200, 2005
11. Daniels C, Krack P, Volkmann J, Raethjen J, Pinsker MO,Kloss M: Is improvement in the quality of life after subthalamic nucleus stimulation in Parkinson’s disease predictable? Mov Disord 26: 2516–2521, 2011
12. Donatus Cyron: Mental Side Effects of Deep Brain Stimulation (DBS) for Movement Disorders: The Futility of Denial. Front Integr Neurosci. 10: 17, 2016
13. E Moro: Complications of DBS surgery— insights from large databases. Nature Reviews Neurology 12: 617–618, 2016
14. Goetz CG, Tilley BC, Shaftman SR, Stebbins GT, Fahn S, Mar- tinez-Martin P: Movement Disorder Society-sponsored revision of the Unified Parkinson’s Disease Rating Scale (MDS-UPDRS): scale presentation and clinimetric testing results. Mov Disord 23: 2129– 2170, 2008
15. Hamani C, Richter E, Schwalb JM, Lozano AM: Bilateral subthal- amic nucleus stimulation for Parkinson’s disease: a systematic re- view of the clinical literature. Neurosurgery 56(6): 1313–1321, 2005
16. Hariz MI, Hirabayashi H: Is there a relationship between size and site of the stereotactic lesion and symptomatic results of pallidoto- my and thalamotomy? Stereotact Funct Neurosurg 69: 28–45, 1997
17. Hariz MI, Shamsgovara P, Johansson F, Hariz G, Fodstad H: Toler- ance and tremor rebound following long-term chronic thalamic stimulation for parkinsonian and essential tremor. Stereotact Funct Neurosurg 72: 208–218, 1999
18. Herzog J, Reiff J, Krack P, Witt K, Schrader B: Manic episode with psychotic symptoms induced by subthalamic nucleus stimulation in a patient with Parkinson’s disease. Mov Disord 18: 1382–1384, 2003
19. Iacono RP, Henderson JM, Lonser RR: Combined stereotactic thal- amotomy anposteroventral pallidotomy for Parkinson’s disease. J Image Guid Surg 1: 133–140, 1995
20. Iacono RP, Shima F, Lonser RR: The results, indications and phys- iology of posteroventral pallidotomy for patients with Parkinson’s disease. Neurosurgery 36: 1118–1127, 1995
21. I.Pereztelo-Perez, A Rivero-Santana, J Perez-Ramos: Deep brain stimulation in Parkinson's disease: meta- analysis of ramdomized controlled trials. J Neurol 261: 2051-2060, 2014
22. Jimenez JC, Salazar PM, Finocchio JA: STN –DBS complicated with cyanoacrylate granullomas and secondary staphylococcal infection. Mov Disord 17(5): 673, 2002
23. Joint C, Nandi D, Parkin S, Gregory R, Aziz T: Hardware-related problems of deep brain stimulation. Mov Disord 17(3): 175–180, 2002
24. Kumar K, Toth C, Nath R: Deep brain stimulation for intractable pain: a 15-year experience. Neurosurgery 40: 736-747, 1997
25. Laitinen LV: Leksell's posteroventral pallidotomy in the treatment of Parkinson's disease 112 (2): 53-61, 2010
26. Le Jeune F, Drapier D, Bourguignon A, Péron J, Mesbah H: Sub- thalamic nucleus stimulation in Parkinson disease induces apathy: a PET study. Neurology 73: 1746–1751, 2009
27. Levy R, Lamb S, Adams J.: Treatment of chronic pain by deep brain stimulation: Long term follow up and review of the literature. Neurosurgery 21: 885-893, 1987
28. Louis ED, Ottman R, Hauser WA: How common is the most com- mon adult movement disorder? Estimates of the prevalence of es- sential tremor throughout the world. MovDisord 13: 5–10, 1998
29. Mandat TS, Hurwitz T, Honey CR: Hypomania as an adverse ef- fect of subthalamic nucleus stimulation: report of two cases. Acta Neurochir (Wien)148: 895– 898, 2006
30. Margaret Kaminska, Sarah Perides , Daniel E. Lumsden ,Vasiliki Nakou , Richard Selway, Keyoumars Ashkan ,Jean-Pierre Lin: Complications of Deep Brain Stimulation (DBS) for dystonia in children. The challenges and 10 year experience in a large paediatric cohort. European Journal of Paediatric Neurology 21(1): 168– 175, 2017
31. Meissner WG: When does Parkinson’s disease begin? From pro- dromal disease to motor signs. Rev Neurol (Paris)168: 809–814, 2012
32. Merello M, Gammarota A, Leiguarda R: Delayed intracerebral electrode infection after bilateral STN implantation for Parkinson’s disease. Mov Disord 16: 168-170, 2001
33. Miocinovic S, Somayajula S, Chitnis S, Vitek JL: History, ap- plications, and mechanisms of deep brain stimulation. JAMA Neu- rol 70: 163–171, 2013
34. Nagaseki Y, Shibazaki T, Hirai T, Kawashima Y, Hirato M, Wada H, Miyazaki M, Ohye C: Long-term follow-up results of selective VIM-thalamotomy. J Neurosurg 65: 296–302, 1986
35. P Richard Schuurman, Andries Bosch, Maruschka Merkus, Jo- hannes Speelman: Long-term follow-up of thalamic stimulation versus thalamotomy for tremor suppression. Movement Disord 23: 1146- 1153, 2008
36. Patel DM, Walker HC, Brooks R: Adverse events associated with deep brain stimulation for movement disorders: analysis of 510 consecutive cases. Neurosurgery 11: 190–199, 2015
37. Santens P, De Letter M, Van Borsel J, De Reuck J, Caemaert J: Lateralized effects of subthalamic nucleus stimulation on different aspects of speech in Parkinson’s disease. Brain Lang 87(2): 253– 258, 2005
38. Schwalb JM, Riina HA, Skolnick B: Revision of deep brain stimu- lation for tremor. Technical note. J Neurosurg 94: 1010-1012, 2001
39. Sofia Rocha, Ana Monteiro, Paulo Linhares, Clara Chamadoira, Margarida Ayres Basto, Carina Reis, Cláudia Sousa, Joana Lima, Maria José Rosas, João Massano and Rui Vaz: Long-Term Mortali- ty Analysis in Parkinson’s Disease Treated with Deep Brain Stimulation. Parkinson's Dis 3: 717041, 2014
40. Tronnier VM, Fogel W, Kronenbuerger M, Steinvorth S: Pallidal stimulation: an alternative to pallidotomy? J Neurosurg. 87(5): 700- 705, 1997
41. Voon V, Krack P, Lang AE: A multicentre study on suicide out- comes following subthalamic stimulation for Parkinson's disease. Brain 131: (10) 2720–2728, 2008
42. Vingerhoets FJ, Russmann H, Pollo C: Results and adverse events in 50 consecutive patients treated by STN-DBS. Mov Disord 17(5): 666, 2002
43. Zeiad Y. Fayed and Aliaa Mansour: Ablative Procedures without Microelectrode Recording in the Management of Advanced Parkin- son’s Disease: Complications, Safety and Outcome Egyptian Jour- nal of Neurosurgery 30(3): 203-212, 2015
44. Zesiewicz TA, Sullivan KL, Hoffmann M: Delayed thalamic in- tracranial hemorrhage in an essential tremor patient following deep brain stimulation. Eur Neurol 59: 187–9, 2008.