Innovative Use of Double Free Flaps with Flow-Through Method in Reconstructing Complex Oromandibular Defects
Innovative Use of Double Free Flaps with Flow-Through Method in Reconstructing Complex Oromandibular Defects
Dr. Vipul Goyal 1, Dr. Mohammed Sameer 2*
1,2. M.ch Surgical Oncology Senior Resident, Cochin Cancer Research Centre, Ernakulam, Kerala, India.
*Correspondence to: Dr. Mohammed Sameer, M.ch Surgical Oncology Senior Resident, Cochin Cancer Research Centre, Ernakulam, Kerala, India.
Copyright.
© 2025 Dr. Mohammed Sameer This is an open access article distributed under the Creative Commons Attribution License, which permits unrestricted use, distribution, and reproduction in any medium, provided the original work is properly cited.
Received: 01 Aug 2025
Published: 21 Aug 2025
DOI: https://doi.org/10.5281/zenodo.17596679
Abstract
Background: A significant proportion of oral cancer patients in India seek treatment at regional cancer care centers only at advanced stages, predominantly stage III or Iva, resulting in extensive resection which has considerable impact on the quality of life.
Introduction: In the era of microvascular free flaps being regarded as the standard of care, for composite oromandibular defects, there is no single flap that adequately addresses all aspects of reconstruction, thereby necessitating the use of double free flaps.
Case discussion: Our study includes a case series of four oral squamous cell cancer patients with extensive oromandibular involvement, reconstructed using free fibula osteocutaneous flap (FFOCF) for bony support and intra-oral mucosal lining as well as acting as the conduit flap to perfuse a second flap, which ensures adequate extra -oral skin coverage with a single set of recipient vessels.
Discussion: The concept of sequentially linked flow through flap although well established in literature, is not widely practiced in reconstruction of complex head and neck defects. This article emphasizes the need for utilization of double flaps in extensive defects to ensure complete reconstruction with optimal functional and aesthetic outcome.
Conclusion: The flow through technique represents an emerging paradigm, making reconstruction of extensive defects possible by addressing the intricate challenges posed by such defects by offering enhanced flexibility in flap configuration.
Keywords: OSCC; FFOCF; ALT; Double Microvascular free flaps; Flow through flap.
Innovative Use of Double Free Flaps with Flow-Through Method in Reconstructing Complex Oromandibular Defects
Introduction
Oral squamous cell carcinoma (OSCC) constitutes 32%–40% of all head and neck cancers (HNC) in India [1] of which a significant proportion of patients seek treatment only at advanced stages, predominantly stage III or IVa [2]. This requires extensive resection often including mandible, mucosa and skin, resulting in significant impact on the patient's quality of life like speech, articulation, mastication, deglutition and aesthetics [3].
These compound defects, requires restoration of bone, skin, and oral lining, challenging the ability of any single osteocutaneous flap to adequately address all aspects of the resultant defects [4]. In the era of microvascular free flap, there is yet no single osteocutaneous free flap which can provide both unlimited bone length and a sufficiently large skin paddle [4], warranting use of more than a single flap for these compound defects.
Use of two free flaps although can ensure unlimited bone length and adequate skin cover, presents with technical difficulty like multiple anastomosis and need of two pairs of recipient vessels.
To address this challenge, our approach utilizes an osteocutaneous flap that provides both bony support and intraoral mucosal coverage while serving as a conduit flap to perfuse a second flap, which ensures adequate extraoral skin coverage, by flow through technique.
Case Discussion
We present four cases of oral squamous cell carcinoma with mandibular and extensive skin involvement. We used Free Fibula Osteocutanoeous Flap (FFOCF) in all four cases for bony reconstruction and intraoral skin lining and Anterolateral thigh flap (ALT) was used for extraoral skin defect. The proximal end of peroneal vessels of fibula free flap were anastomosed with recipient neck vessels and the distal end was anastomosed with the septocutaneous perforators of lateral circumflex femoral artery of anterolateral thigh flap, thereby fibula free flap acting as a conduit flap for the perfusion of anterolateral thigh flap. Standard operative techniques were used for harvesting the flaps. We have used 8-0 nylon with 6.4mm micropoint needle for anastomosis of peroneal vessels with recipient neck vessels and 10-0 micropoint needle for anastomosis of peroneal to perforators of ALT flap. The recipient vessels in the neck were decided based on the length of available stumps. Contralateral limb was used for harvesting fibula and the same side limb was used for ALT.
Case 1:
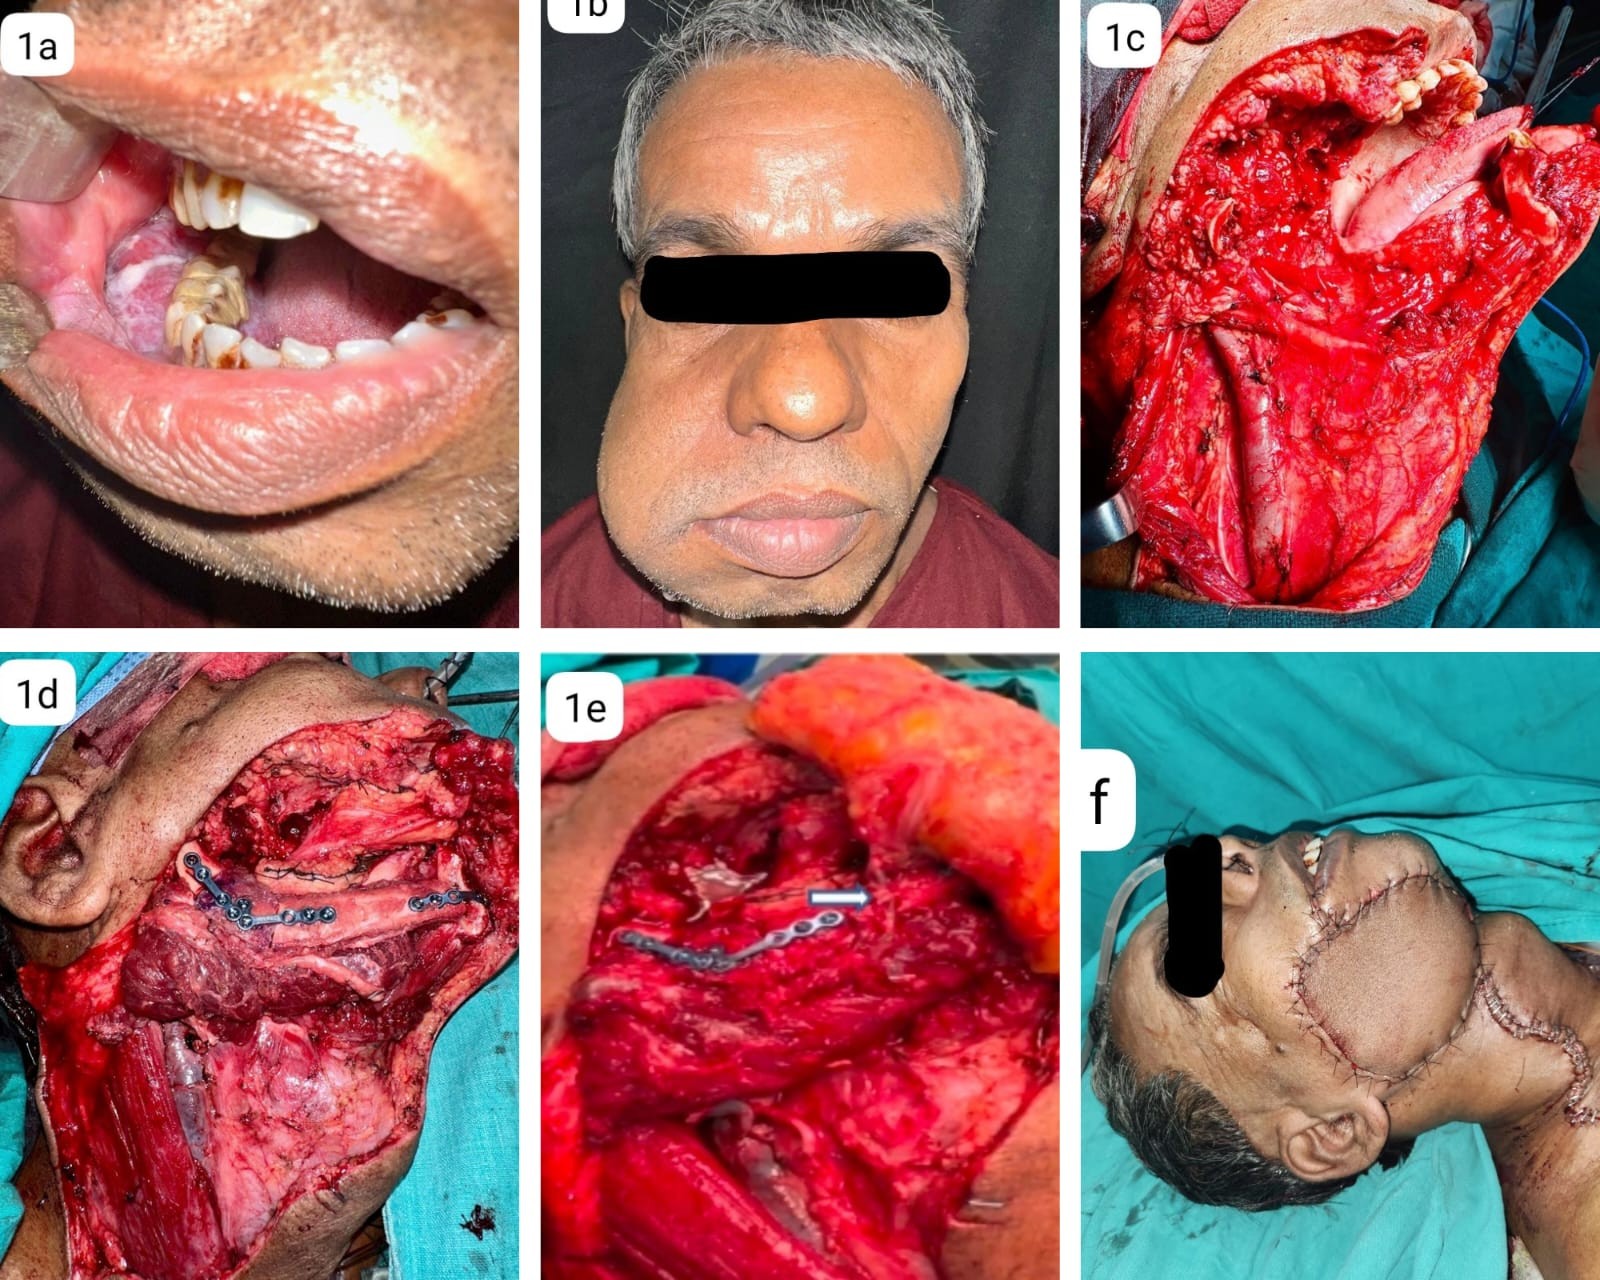
Our first case is a male patient diagnosed with carcinoma of the right lower alveolus, extending to the lower gingivobuccal sulcus and lingual sulcus, from the first premolar to the retromolar trigone, with extensive skin involvement reaching the lower border of the zygoma. The clinical staging was T4aN0MO. The patient underwent right Bite-composite resection with condyle preserving right hemi mandibulectomy and a MRND (I-V), performed in usual steps. Defect reconstruction done with fibula and anterolateral thigh flap with fibula acting as a conduit flap. Recipient neck vessels used are facial artery and internal jugular vein in end to side fashion. Post operative period uneventful. Patient completed adjuvant radiotherapy. At present, the patient is on regular follow-up, has post radiation adverse effects such as pigmentation and mucositis, but has comprehensible speech articulation and is able to swallow soft diet.
Fig 1: 1a, b: Shows the extent of the growth in case 1, 1c: Shows the extent of defect. 1d: Bony reconstruction done with free fibula flap. 1e: Shows the anastomosis of distal end of peroneal vessels to the perforators of anterolateral thigh free flap. (white arrow). 1f: Final closure.
Case 2:
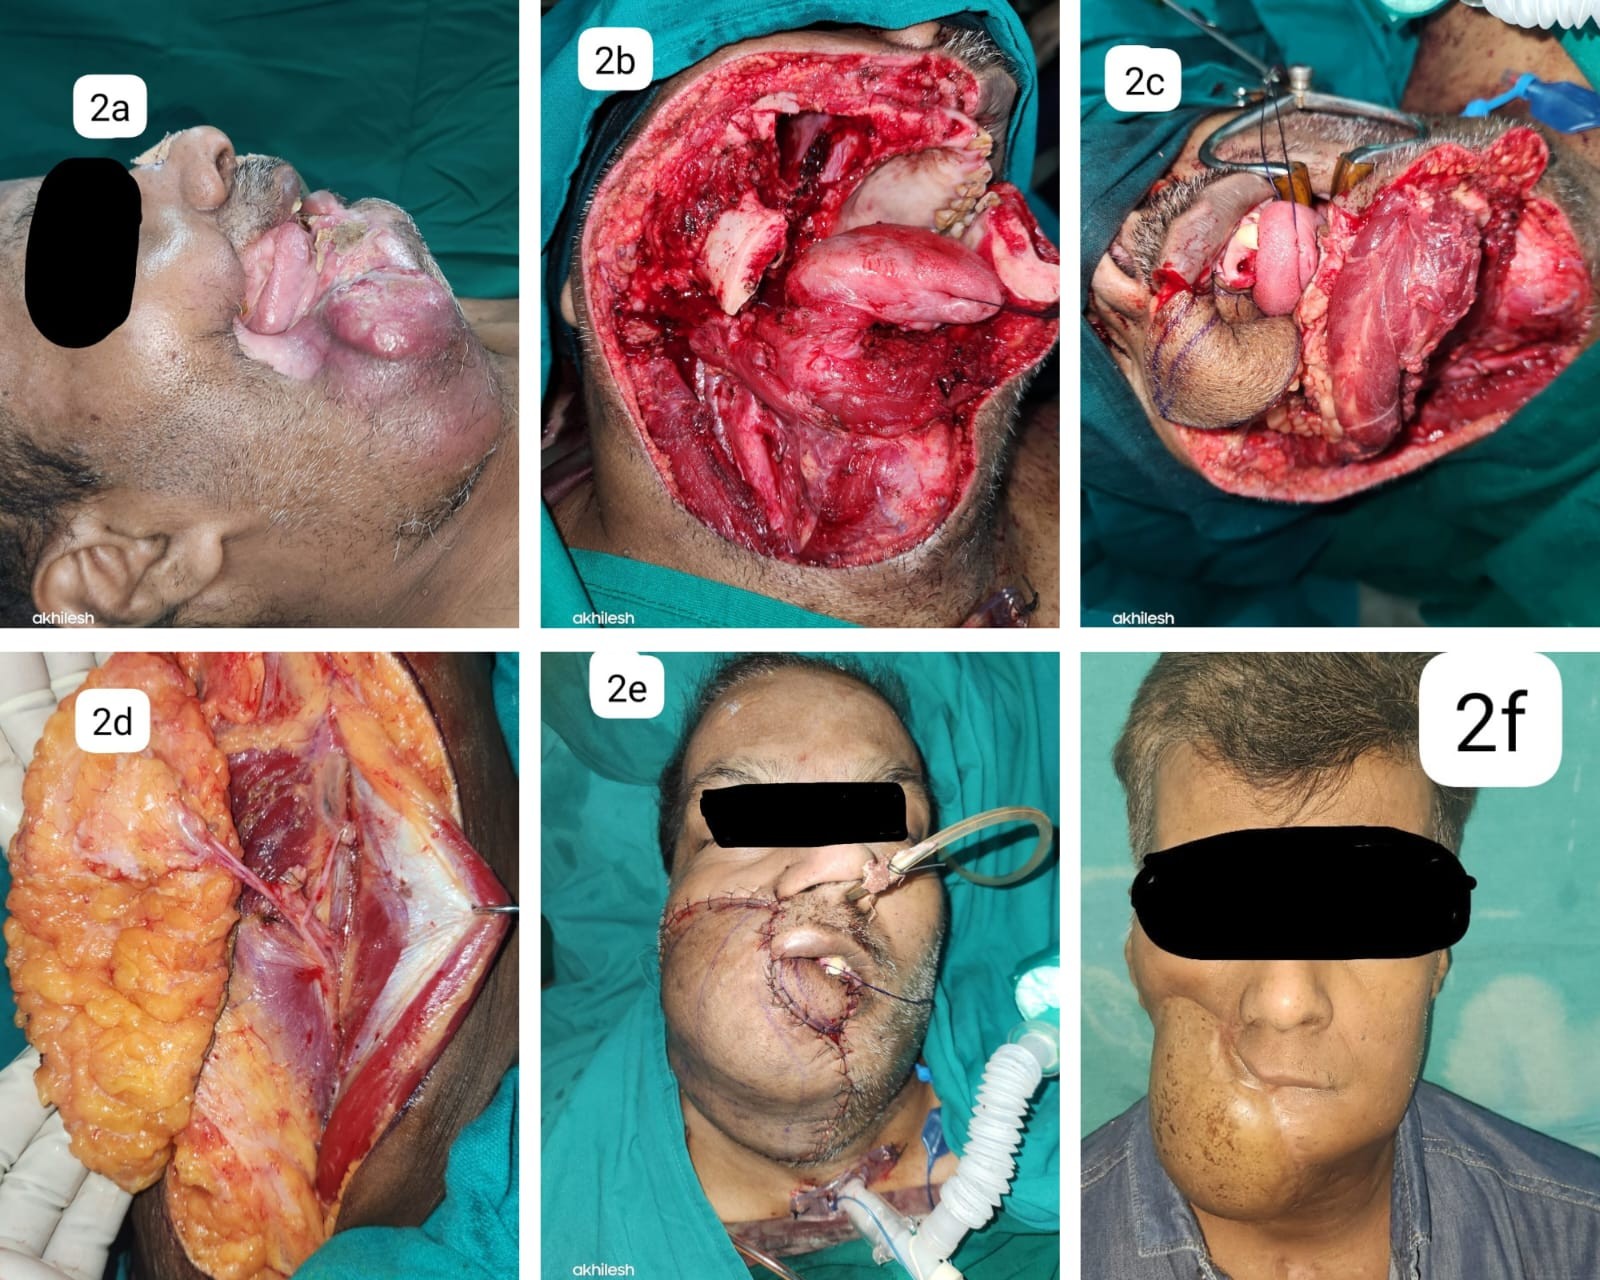
Our second case is a male patient diagnosed with carcinoma of the right lower lip, extensively affecting the cutaneous and mucosal portions of the lip, buccal mucosa, and mandible, along with significant skin involvement. The clinical staging was cT4aN0M0. Wide local excision of the tumor including right-sided segmental mandibulectomy (spanning from the first premolar on the left to the first premolar on the right) along with Rt MRND was performed. Defect reconstruction is similar to the previous case and recipient neck vessels used were facial artery and facial vein. Post-operatively, the patient underwent Adjuvant chemoradiotherapy and fig 2f shows the cosmetic results after 6 months of follow-up. At present, the patient has good comprehensible speech and is on a normal diet.
Fig 2: 2a: Shows the extend of growth in case 2. 2b: Shows the extend of defect. 2c: Shows the bony reconstruction and intraoral mucosal cover given by fibula free flap. 2d: Picture showing the septocutaneous perforator in the harvested anterolateral thigh flap. 2e: The extensive skin defect reconstructed with the anterolateral thigh flap 2f: Follow up pic with good cosmesis after 6 months.
Case 3:
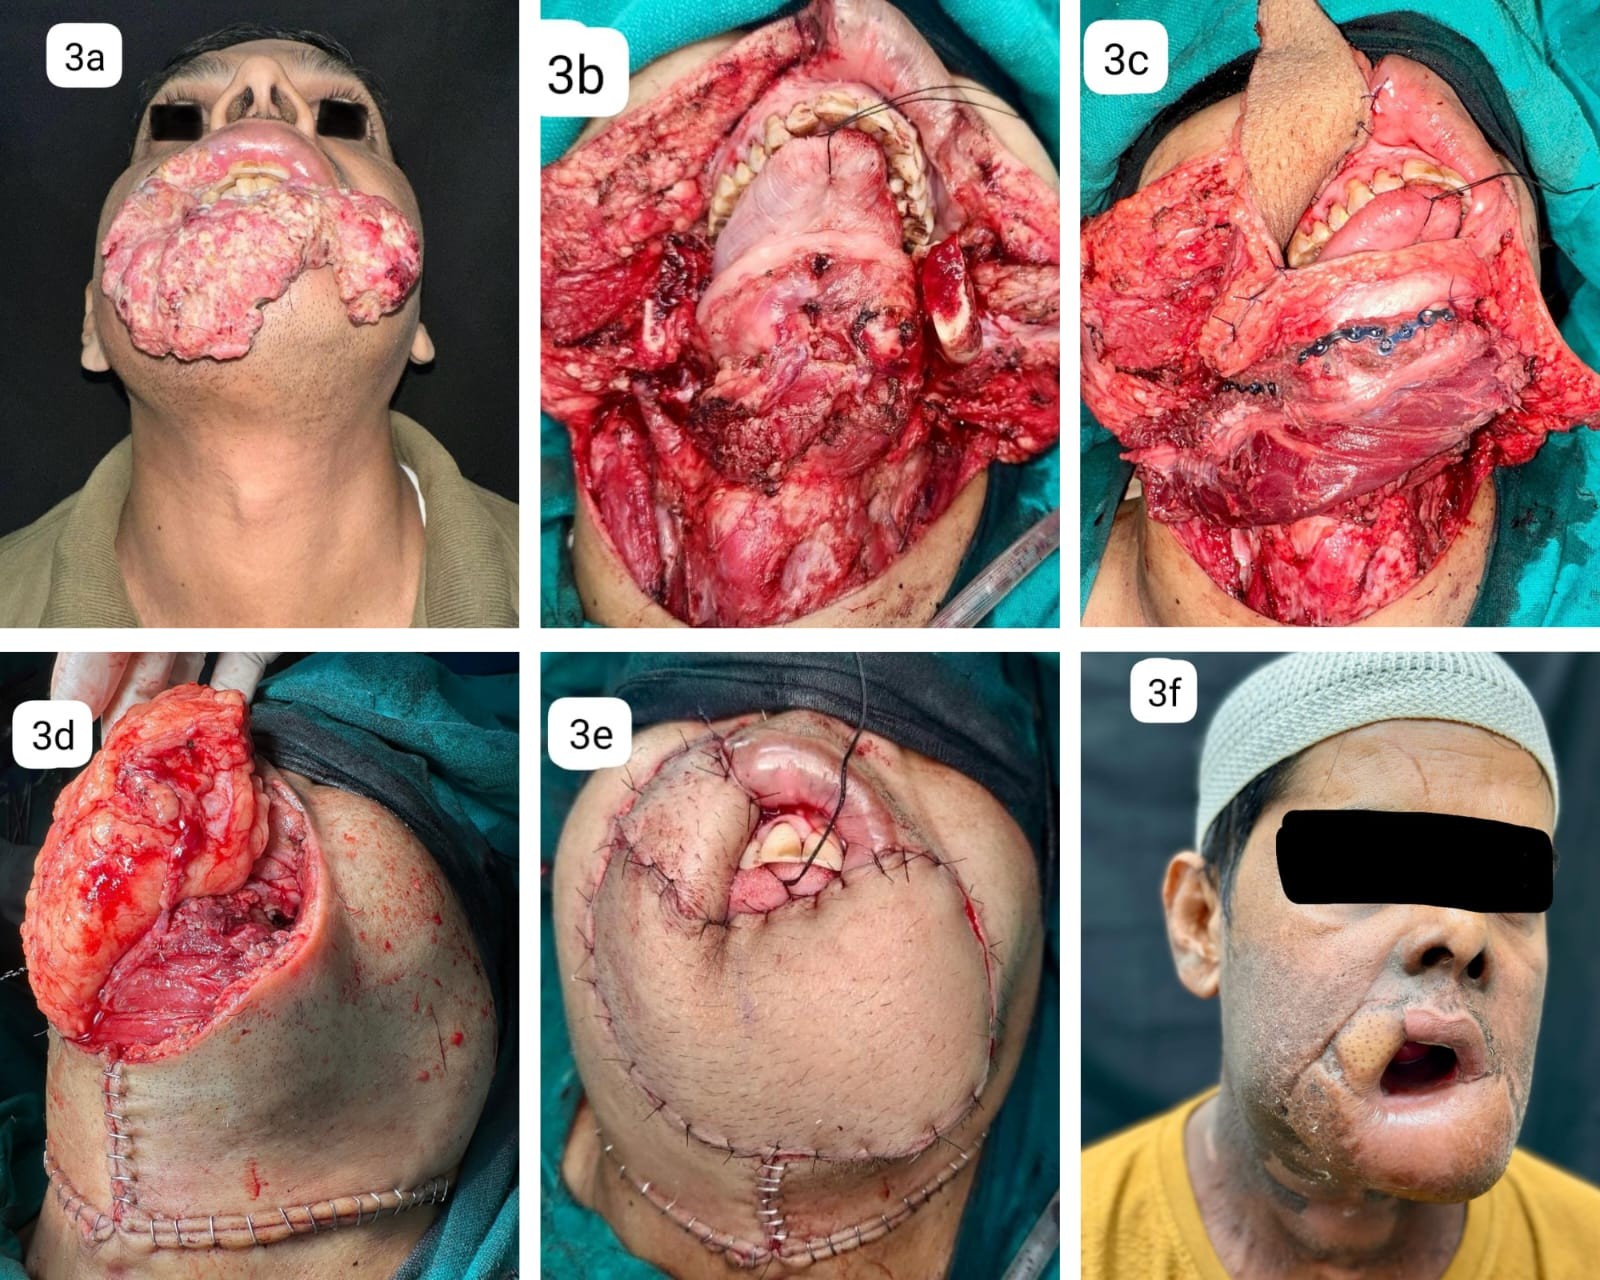
Our third case is a male patient diagnosed with carcinoma of the lower lip and extending to the right third of the upper lip, anterior lower gingivo-lingual sulcus, bilateral lower gingivobuccal sulcus and buccal mucosa with extensive dysplastic changes extending up to the bilateral 3rd molar with extensive skin involvement in mentum. The clinical staging was T4aN1M0. The patient underwent a Wide local excision of the tumor via a Visor incision along with an anterior arch mandibulectomy extending to bilateral angles of the mandible, right MRND (I-V) and a left extended SOHND (I-IV) with similar reconstruction. The Facial artery and vein were preserved on both sides for anastomosis. Adjuvant radiotherapy completed and patient has good functional outcome.
Fig 3: 3a: Shows the extent of the growth in case 3. 3b: Extend of defect. 3c: Bony and intraoral cover given by free fibula flap. 3d: Picture showing the anastomosis of distal end of peroneal vessels to septocutaneous perforators of anterolateral thigh flap. 3e: Extensive skin defect closed majorly with anterolateral thigh flap and part of fibula flap in the right lateral part of upper lip. 3f: Follow up pic at 6 months
Case 4:
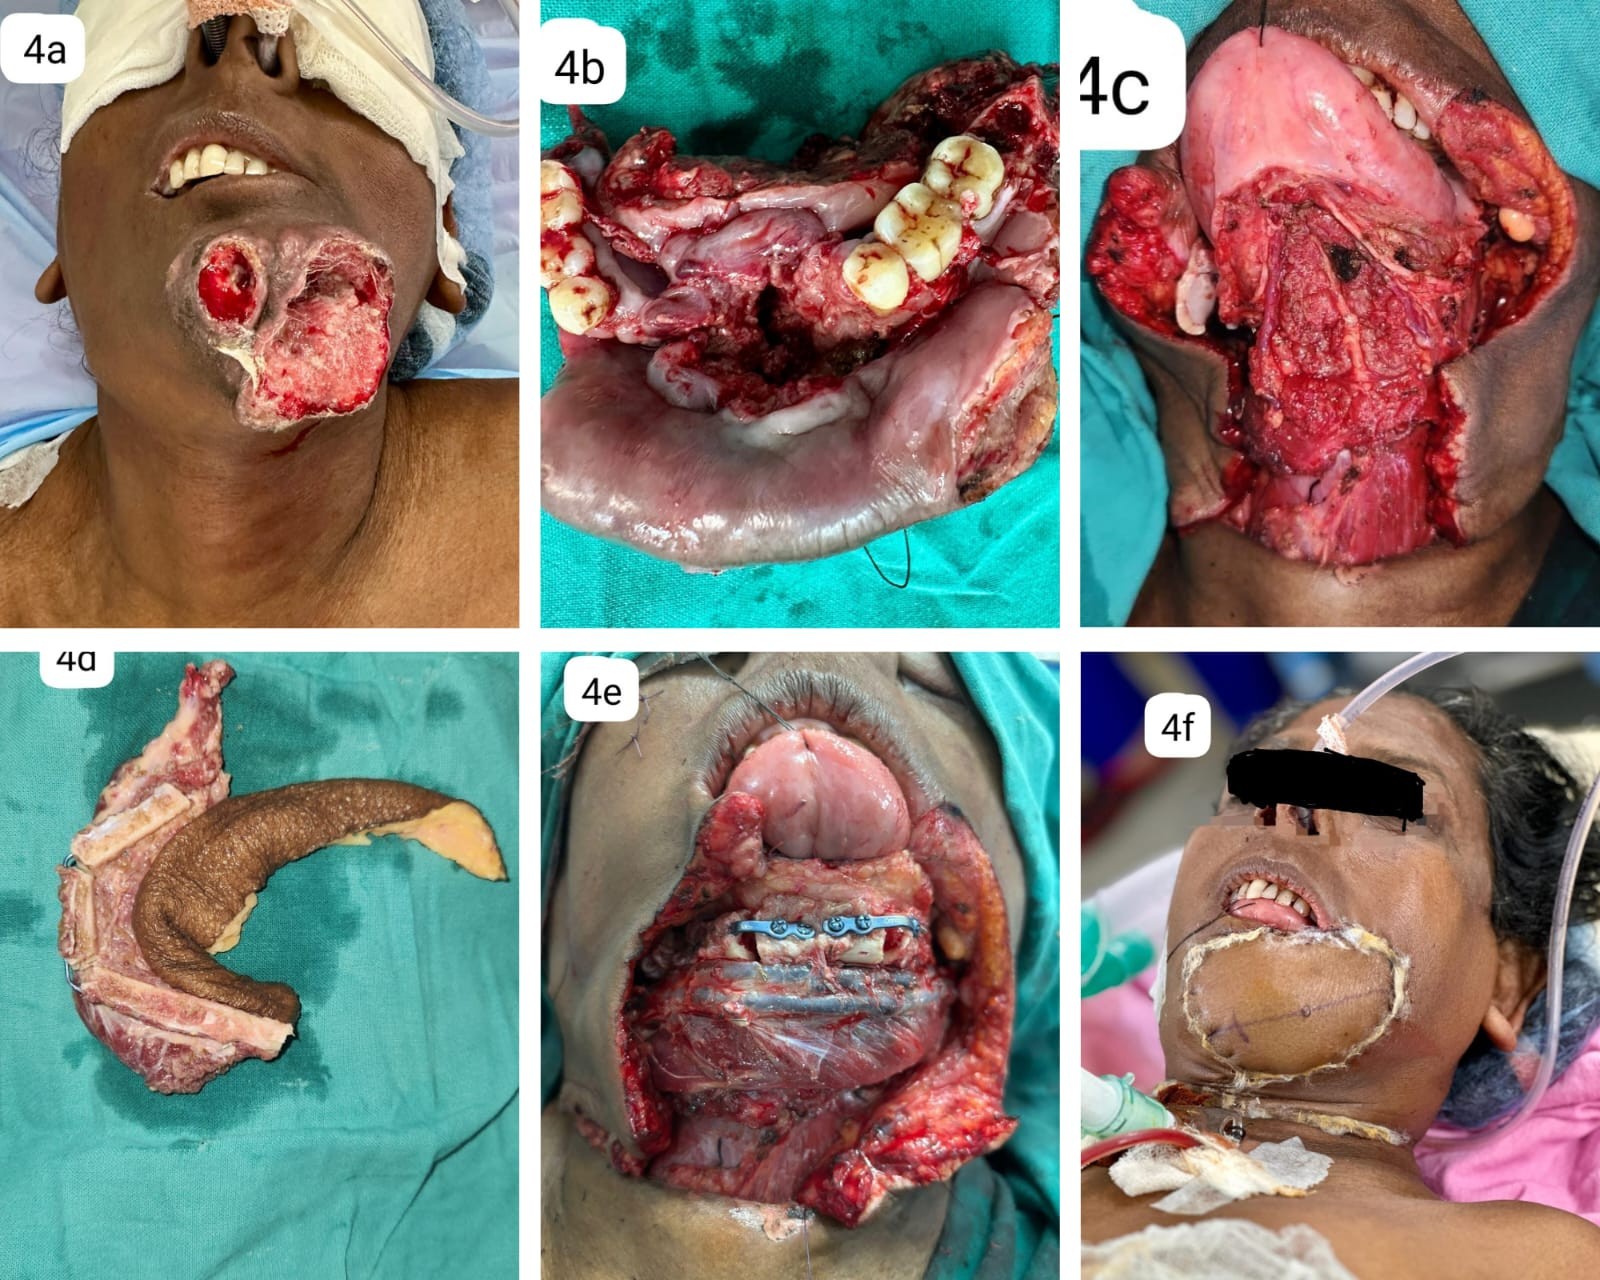
Female patient with carcinoma of central arch of mandible with tumor extending anteriorly to gingivolabial sulcus and central third of lower lip, posteriorly to the gingivolingual sulcus, floor of mouth and ventral aspect of tongue, laterally from Rt lower 2nd molar to left lower third molar, with skin involvement in mentum. Clinical staging being cT4aN2bM0. Patient underwent angle to angle central arch mandibulectomy, resection of floor mouth, ventral tongue, entire lower lip and mentum skin with similar reconstruction. Recipient vessels used were superior thyroid artery and facial vein. Completed adjuvant radiotherapy and is on regular follow-up with speech and swallow rehabilitation therapy.
Fig 4: 4a: Extend of the growth. 4b: Resected specimen showing the intraoral extend of growth. 4c: Picture showing the defect. 4d: Harvested fibula flap with osteotomies. 4e: Bony reconstruction with fibula free flap. 4f: Skin cover given by anterolateral thigh flap.
Discussion
Extensive composite mandibular defects are defined as en-bloc defects involving bone, oral lining, external skin, and soft tissue [5]. These defects present significant reconstructive challenges in the head and neck region. The primary goals of reconstruction are to restore essential oromandibular functions and achieve a socially acceptable appearance [3]. However, it is often recognized that a single free flap may not provide the optimal aesthetic and functional outcomes due to limitations in tissue components, dimensions, and volume [6].
The anterior mandible, as the primary contact point for food, must withstand substantial loading forces, making reconstruction with a bone-containing free flap the standard of care [7]. Additionally, the dead space created by the removal of masticatory muscles, buccal fat, and the parotid gland must be addressed. If left unobliterated, this space can accumulate fluids, increasing the risk of secondary infections that threaten flap survival. Even in cases where the dead space seals and the flap survives, the unsupported skin paddle can cause contraction can lead to complications such as a sunken appearance, trismus, and difficulties with swallowing, speaking, and chewing. Contraction may even distort the reconstructed bony arch if it is not accommodated by the soft-tissue displacement. Also, adequate soft tissue coverage is crucial to prevent bone and plate exposure [8], underscoring the necessity for both bony and soft tissue components in reconstructing complex oromandibular defects.
Various strategies have been proposed to address these challenges, including the simultaneous use of two free flaps [9]. However, this approach can pose technical difficulties, such as the need for two pairs of recipient vessels and performing two sets of anastomoses. These challenges are particularly pronounced in patients with vessel depletion due to prior neoadjuvant chemotherapy, radiation or surgery.
To address these challenges, the concept of a flow-through flap was employed. This approach facilitates uninterrupted vascular flow to support two distinct free flaps during a single-stage reconstruction using a single set of recipient vessels. This technique provides greater flexibility in configuring the soft tissue and bony flap inset for optimal outcomes. The concept of the flow-through flap was first introduced by Soutar et al. [10] and has since become well-established, with its indications for use continuing to expand.
The FFOCF can be transferred as either a free osseous or osteocutaneous flap. Its ability to provide up to 25 cm of bone makes it particularly well-suited for reconstructing total or subtotal mandibular defects [11], all while causing minimal donor site morbidity. Additionally, the peroneal artery and vein run consistently along the entire length of the fibula without significant changes in vessel calibre, enabling its use as a conduit flap [12].
However, the fibula free flap has limitations in providing adequate soft tissue and extraoral skin coverage. This shortcoming is typically addressed by incorporating a second flap, such as the ALT flap, as seen in the above-mentioned cases. The ALT flap provides ample soft tissue to effectively obliterate dead space, restore facial contour, and offers a large skin paddle [13]. These advantages, combined with the ALT flap’s long vascular pedicle, make it an excellent choice for use in sequential flap reconstructions.
In the above-mentioned cases, all three patients presented with extensive skin and mandibular involvement, necessitating the use of combination flaps. The FFOCF was selected as a conduit flap, while the ALT flap was chosen for soft tissue bulk, for the reasons outlined earlier.
We followed the standard flap-monitoring protocol in all our patients, comprising of scratch test and doppler monitoring, done regularly [14]. The recovery period for all four patients was uneventful. None of the patients required re-exploration of the flaps, reducing post-operative morbidity. By the end of three months, all cases demonstrated excellent cosmetic and functional outcomes, including swallowing, speech, and articulation [15], and was free of nasogastric tube. There were no significant donor site morbidities observed in any of the cases.
The only potential pitfall of sequential flaps is the risk of failure of both flaps if the conduit flap becomes thrombosed. This issue can be mitigated with vigilant postoperative monitoring. Although some literature cites an increase in operative time as a disadvantage of sequential flaps [4], this was not a concern in our series, as separate surgical teams were employed to simultaneously perform the primary resection and harvest both the flaps, optimizing efficiency.
Conclusion
The flow-through technique represents a groundbreaking paradigm in addressing the intricate challenges posed by complex oromandibular defects. By enabling the simultaneous use of two free flaps through a single set of recipient vessels, this method ensures adequate reconstruction of both bony and soft tissue components. This innovative approach not only optimizes functional and aesthetic outcomes but also offers enhanced flexibility in flap configuration, making it a game-changer in the field of head and neck reconstruction.
References
1. Sathishkumar K., et al. “Cancer incidence estimates for 2022 & projection for 2025: Result from National Cancer Registry Programme, India”. Indian Journal of Medical Research 156.4&5 (2022): 598-607.
2. Chakrabarti S, Chakrabarti PR, Desai SM, Agrawal D, Mehta DY, Pancholi M. Reconstruction in oral malignancy: Factors affecting morbidity of various procedures. Ann Maxillofac Surg. 2015 Jul-Dec;5(2):191-7. doi: 10.4103/2231-0746.175748. PMID: 26981469; PMCID: PMC4772559.
3. Yazar S. Selection of recipient vessels in microsurgical free tissue reconstruction of head and neck defects. Microsurgery. 2007;27(7):588-94. doi: 10.1002/micr.20407. PMID: 17868144.
4. Costa H, Zenha H, Azevedo L, Rios L, da Luz Barroso M, Cunha C. Flow-through sequentially linked free flaps in head and neck reconstruction. European Journal of Plastic Surgery. 2012 Jan; 35:31-41.
5. David DJ, Tan E, Katsaros J, Sheen R. Mandibular reconstruction with vascularized iliac crest: a 10-year experience. Plast Reconstr Surg. 1988 Nov;82(5):792-803. doi: 10.1097/00006534-198811000-00011. PMID: 3174869.
6. Blackwell KE, Buchbinder D, Biller HF, Urken ML. Reconstruction of massive defects in the head and neck: the role of simultaneous distant and regional flaps. Head Neck. 1997 Oct;19(7):620-8. doi: 10.1002/(sici)1097-0347(199710)19:7<620: aid-hed10>3.0.co;2-6. PMID: 9323152.
7. Hurvitz KA, Kobayashi M, Evans GRD. Current options in head and neck reconstruction. Plast Reconstr Surg. 2006 Oct;118(5):122e-133e. doi: 10.1097/01.prs.0000237094. 58891.fb. PMID: 17016169.
8. Chen HC, Demirkan F, Wei FC, Cheng SL, Cheng MH, Chen IH. Free fibula osteoseptocutaneous-pedicled pectoralis major myocutaneous flap combination in reconstruction of extensive composite mandibular defects. Plast Reconstr Surg. 1999 Mar;103(3):839-45. doi: 10.1097/00006534-199903000-00009. PMID: 10077072.
9. Wei FC, Celik N, Chen HC, Cheng MH, Huang WC. Combined anterolateral thigh flap and vascularized fibula osteoseptocutaneous flap in reconstruction of extensive composite mandibular defects. Plastic and reconstructive surgery. 2002 Jan 1;109(1):45-52.
10. Soutar DS, Scheker LR, Tanner NSB, McGregor IA (1983) The radial forearm flap: a versatile method for intra-oral reconstruc tion. Br J Plast Surg 36:1.
11. Gilbert RW, Dorion D. Near-total mandibular reconstruction: The free vascularized fibular transfer. Operative Techniques in Otolaryngology-Head and Neck Surgery. 1993 Jun 1;4(2):145-8.
12. Mark LU, Mack LC, Keith EB, Jeffrey RH, Tessa AH, Neal F. Regional and Free Flaps for Head and Neck Reconstruction. Balitmore: Lippincott Williams & Wilkins; 2012.405 p.
13. Ceulemans P, Hofer SO (2004) Flow-through anterolateral thigh flap for a free osteocutaneous fibula flap in secondary composite mandible reconstruction. Br J Plast Surg 57:358–61
14. Vincent A, Sawhney R, Ducic Y. Perioperative Care of Free Flap Patients. Semin Plast Surg. 2019 Feb;33(1):5-12. doi: 10.1055/s-0038-1676824. Epub 2019 Mar 8. PMID: 30863206; PMCID: PMC6408252.
15. Sakuraba M, Miyamoto S, Fujiki M, Higashino T, Oshima A, Hayashi R. Analysis of functional outcomes in patients with mandible reconstruction using vascularized fibular grafts. Microsurgery. 2017 Feb;37(2):101-104. doi: 10.1002/micr.22433. Epub 2015 Jun 6. PMID: 26052686.